


 0
0


Specifications:
| Application | Protein Assays & Analysis |
| Storage Temperature | Ambient |
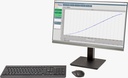
| Product Type | Software, Computor |
| Product Brand | QUANSYS Biosciences |
| Product Grade | Molecular Biology |
The Q-View Software Version 3.14 is a powerful, user-friendly imaging and data analysis platform developed for quantitative analysis of Q-Plex™ multiplex arrays and standard ELISA assays. Designed specifically for use with Q-View imaging systems, the software enables accurate chemiluminescent signal capture, regression modeling, statistical validation, and customizable reporting.
Whether processing a single plate or managing high-throughput projects involving hundreds of assays, Q-View Software streamlines workflow from image acquisition to final data export.
Product Overview
Q-View Software integrates advanced imaging algorithms with flexible quantitative analysis tools to ensure sensitive signal detection and reliable concentration calculation. The platform supports multiple regression models, robust weighting options, automated quality control checks, and direct compatibility with LIMS platforms.
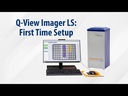
Built for both the Q-View™ Imager LS and the Q-View™ Imager Plus, the software forms the analytical backbone of the Q-Plex™ multiplex system.
What’s New in Version 3.14
The latest update enhances usability, accuracy, and hardware integration with several improvements:
- Seamless integration with Q-View™ Imager Plus
- Automated error legend showing “NA” when no report errors exist
- Enhanced product code entry with drop-down history and tab-to-commit support
- Inclusion of LOB and LOD in generated reports
- New error code for %CV > 30% in replicate samples or controls
- Improved ULOQ rounding accuracy
- LLOQ constrained to not fall below LOD
- Support for HDR individual standards
- Multiple performance and stability enhancements
Core Analytical Capabilities
Regression Models
- 4-Parameter Logistic (4PL)
- 5-Parameter Logistic (5PL)
- Automatic model selection based on calibrator recovery
Weighting Options
- Five selectable weighting models to address uneven variance
Data Quality Controls
- Outlier masking
- Automatic error flagging
- %CV validation thresholds
- Inclusion of LOB, LOD, LLOQ, and ULOQ
Reporting & Export
- Customizable charts and tables
- Assay-specific statistics
- LIMS-compatible export formats
- Template storage for repeat workflows
Get Results in 3 Easy Steps

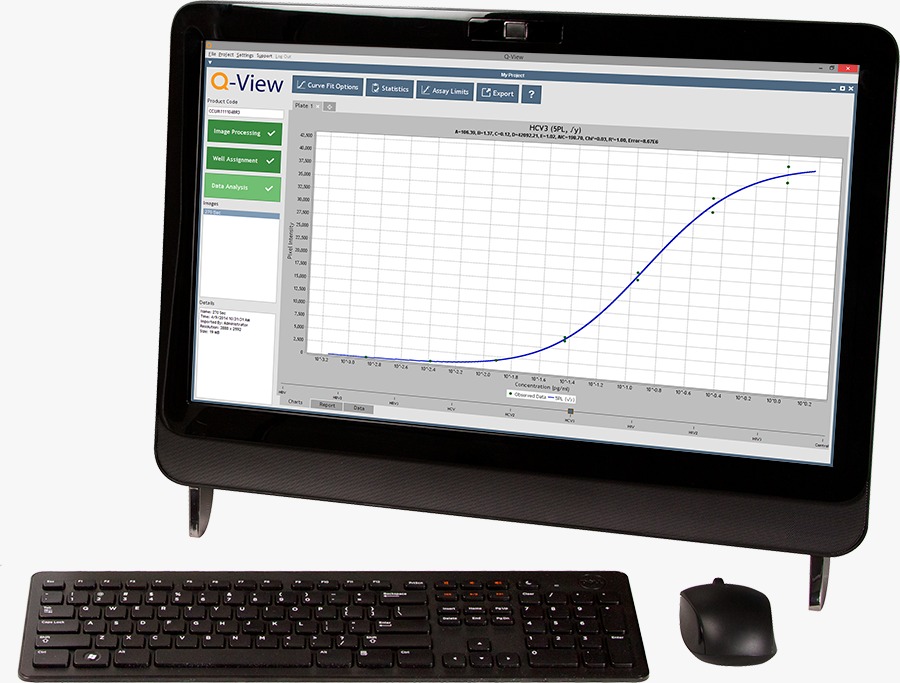
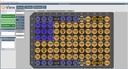
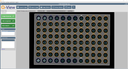
1) Image Processing
A high-resolution image of the plate is captured. Unique product codes are utilized by Q-View Software to determine the location of spotted capture material in each well. Product codes also contain information about standard curve concentrations, optimal regression models, and model weighting.

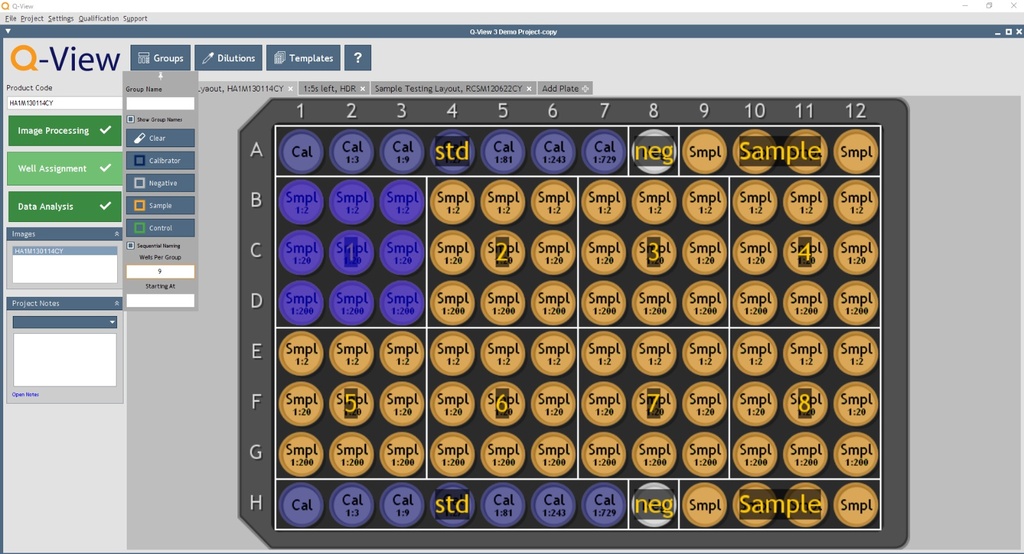
2) Well Assignment
The user defines what is in each well using an easy-to-use interface. Wells can be coded as Calibrator, Sample, Control, or Negative. Tools for sequential naming allow users to quickly set up replicate samples and controls then assign dilution factors.
Well assignment information can be stored as a template to expedite well assignment in future projects.

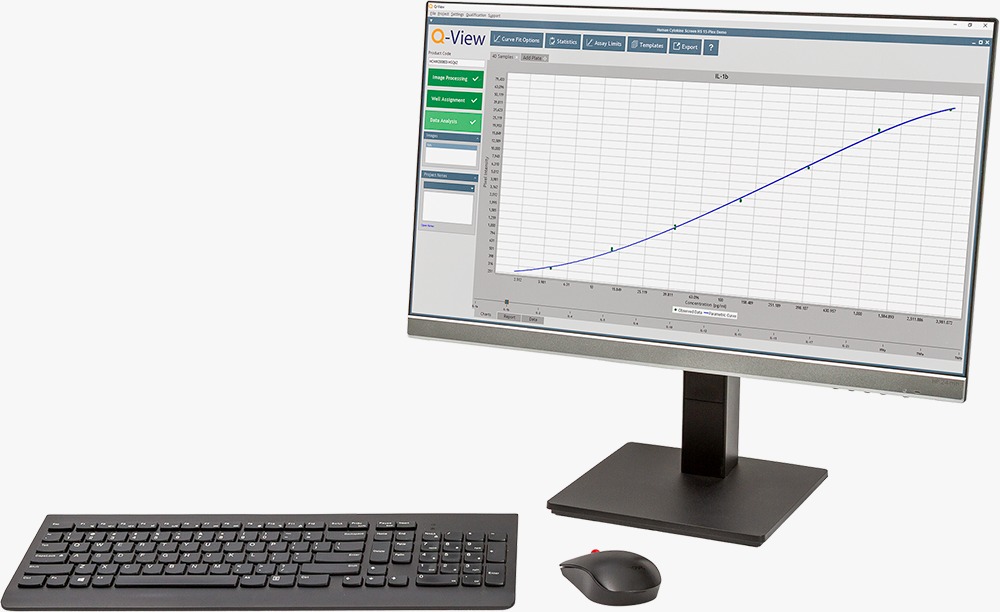
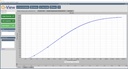
3) Analyze & Export
Q-View Software converts signal to concentration values. The optimal regression model is determined based recovery of the calibrator points.
Generate customizable analysis reports compatible with various LIMS platforms, including assay-specific statistics to assess project quality.
System Compatibility
Q-View Software is designed for use with:
- Q-View Imager LS
- Q-View Imager Plus
Both imagers rely on Q-View Software for full functionality and quantitative data analysis.
Computer Specifications
Operating System
- Windows® 10 or 11 (Required for imager operation)
- Mac® OS 10.15 or newer (analysis only; not compatible with imagers)
Minimum Requirements
- Processor: 4 cores
- RAM: 8 GB
- Screen Resolution: 1280 × 800 or greater
- USB 2.0 (Type A) or greater for Imager LS and Imager Pro
Recommended Configuration
- Processor: 8+ cores
- RAM: 16 GB or higher
- USB 3.0 (Type A) for Imager Plus
USB-C connections are not supported.
Applications
- Multiplex cytokine profiling
- Nutritional biomarker analysis
- Inflammatory marker quantification
- Global health and epidemiological studies
- Vaccine response monitoring
- Standard ELISA data processing
Q-View Software provides a fully integrated solution for chemiluminescent multiplex analysis, combining advanced curve fitting with automated quality control and customizable reporting. The platform ensures consistency, precision, and scalability for laboratories conducting both small-scale and high-throughput immunoassay research.